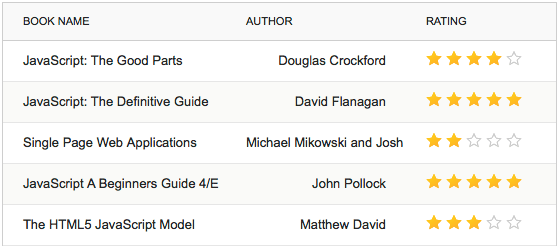
This quick tutorial leads you through the steps of adding a simple star rating bar in a cell of dhtmlxGrid. You’ll learn how to create a custom exCell (“extended cell”) that allows the end users to view/set the rating of an item in our JavaScript datagrid.

Download the demo with a star rating bar in a grid or read the tutorial and see how it can be done step by step.
Step 1 – Creating a Custom ExCell Type
Let’s start the creation of a custom exCell. ExCell is a unique mechanism of dhtmlxGrid that defines the data format and the way of editing data for each column (cell) in a grid. We’ll take a standard read-only “ro” exCell as a basis of our custom exCell:
eXcell_ro.call(this, cell);
}
eXcell_rating.prototype = new eXcell; // nest all other methods from base class
Step 2 – Setting Style for Custom ExCell
The content of a cell with a star rating bar will be the following:
<a rating="1" class="gridRatingMarker"></a> //single star icon
<a rating="2" class="gridRatingMarker"></a>
<a rating="3" class="gridRatingMarker"></a>
<a rating="4" class="gridRatingMarker"></a>
<a rating="5" class="gridRatingMarker"></a>
</div>
We also add CSS for our rating star icons:
.stars {float:left; height:20px;}
.stars li{float:left;}
.stars li a:hover,.stars .rated{background:url(codebase/imgs/rating/star_1.png) no-repeat; width:20px; height:20px;}
.stars a{float:left;background:url(codebase/imgs/rating/star_2.png) no-repeat;width:20px; height:20px;}
</style>
We set path to the images of the stars in the parameter background. In our case:
- star_1.png – for rated star icon
- star_2.png – for unrated (empty) star icon
Step 3 – Rendering Star Rating Bar in a Grid Cell
The next step is to set up the function setValue that is responsible for rendering of a cell content. We modify this function like this:
var r_val="<div class='stars'>";
for (var i=1; i<=5; i++){
if (val>=i){
r_val+="<a rating='"+i+"' class='rated gridRatingMarker'></a>" //set a rated star
}
else{
r_val+="<a rating='"+i+"' class='gridRatingMarker'></a>"; // set an unrated star
};
};
r_val+="</div>";
this.setCValue(r_val,val);
};
When referring to a cell value, we need to get an original rating value and not the HTML content that was placed in the cell. Therefore, before forming the HTML content of the cell, we need to save its original value and place it into the new function getValue:
this.cell.orig_val = val; // saving the original value of the cell
…
}
this.getValue=function(){ // adding the getValue function which returns the original value of the cell
return this.cell.orig_val;
}
Step 4 – Adding the Ability to Set Rating to a Selected Item
Now we need to add event listeners to our star elements to make them react on the user’s actions. We will use the dhtmlxEvent functionality to add the event handlers to the dhtmlxGrid body.
Hovering over any rating star will turn on the mode, when the user can set a new rating to an item. So instead of showing the current average rating of the item we should highlight the stars according to the hovering star.
If the user hovers the mouse on the star which defines mark “4”, stars with mark “1”, “2” and “3” should also be highlighted.
var el = e.target || e.scrElement;
if ((el.className || "").indexOf("gridRatingMarker") !="-1"){ // check if the observable object has the class "gridRatingMarker"
for( var i=1; i<=5; i++){ //iterating through the star icons
if(i<=el.getAttribute("rating")){
el.parentNode.childNodes[i-1].className = "rated gridRatingMarker" // highlight the star
}else{
el.parentNode.childNodes[i-1].className = "gridRatingMarker" // set the star as unmarked
};
};
}
});
If the user leaves a star icon without clicking on it, we should put back the average rating of the item.
var el = e.target || e.scrElement;
if ((el.className || "").indexOf("gridRatingMarker") !="-1"){
_grid.cells4(el.parentNode.parentNode).setValue(_grid.cells4(el.parentNode.parentNode).getValue()); //set the original saved value of the cell
}
});
If the user clicks on a star icon, then a new rating value should be applied.
var el = e.target || e.scrElement;
if ((el.className || "").indexOf("gridRatingMarker") !="-1"){
_grid.cells4(el.parentNode.parentNode).setValue(el.getAttribute("rating")); // setting a new value to a cell
}
});
We need to place these events in our exCell function.
NOTE that the events should be attached only once but not to each row in your grid. So to avoid the events cloning, make sure that the events haven’t been already attached.
For example:
// attaching your events
_grid._run_rating_once = true;
};
Now our exCell is ready and the final code should look the following way:
eXcell_ro.call(this, cell);
if (cell){
var _grid = this.grid;
if (!_grid._run_rating_once){
dhtmlxEvent(_grid.entBox, "mouseover", function(e){
var el = e.target || e.scrElement;
if ((el.className || "").indexOf("gridRatingMarker") !="-1"){
for( var i=1; i<=5; i++){
if(i<=el.getAttribute("rating")){
el.parentNode.childNodes[i-1].className = "rated gridRatingMarker"
}else{
el.parentNode.childNodes[i-1].className = "gridRatingMarker"
};
};
}
});
dhtmlxEvent(_grid.entBox,"mouseout", function(e){
var el = e.target || e.scrElement;
if ((el.className || "").indexOf("gridRatingMarker") !="-1"){
_grid.cells4(el.parentNode.parentNode).setValue(_grid.cells4(el.parentNode.parentNode).getValue());
}
});
dhtmlxEvent(_grid.entBox,"mousedown", function(e){
var el = e.target || e.scrElement;
if ((el.className || "").indexOf("gridRatingMarker") !="-1"){
_grid.cells4(el.parentNode.parentNode).setValue(el.getAttribute("rating"));
}
});
_grid._run_rating_once = true;
}
}
this.setValue=function(val){
this.cell.orig_val = val;
var r_val="<div class='stars'>";
for (var i=1; i<=5; i++){
if (val>=i){
r_val+="<a rating='"+i+"' class='rated gridRatingMarker'></a>"
}
else{
r_val+="<a rating='"+i+"' class='gridRatingMarker'></a>";
};
};
r_val+="</div>";
this.setCValue(r_val,val);
};
this.getValue=function(){
return this.cell.orig_val;
}
}
eXcell_rating.prototype = new eXcell;
That’s all. Now we’ve got a rating control inside the grid column. You can download the demo and customize the code of this custom exCell for your needs and add necessary interactivity to the rating bar.